Dec 11 2017
Design
MADE-Dashboard (pdf)
In an ordinary classroom, teachers monitor their students’ emotional reactions while learning, even if only by glancing at their faces while they work. In this way, teachers can gauge the effectiveness of their teaching strategies, determining whether students are bored, frustrated, or anxious. Teachers can see how emotions change over time, perhaps from positive, to challenged, and later triumphant. All this is difficult with educational software used online.
MADE Ratio (pdf)
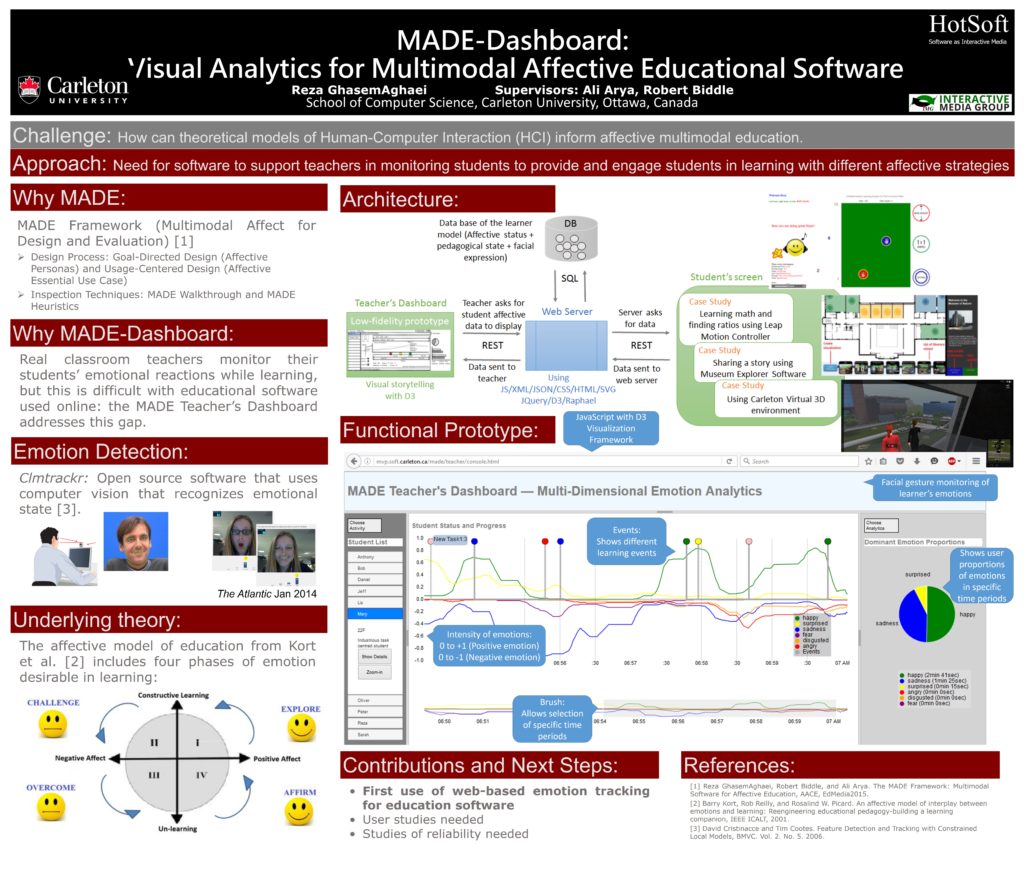
This case study addresses the use of multiple sensory modalities and aff ective strategies in learning mathematics. These domains are used to design a mathematical ratio system. We adopted a multimodal approach used by other researchers, and applied our proposed design methods to create the MADE Ratio system. We then recruited participants to test the usability of the system. Our fi ndings were that the design methods were eff ective, but we also gained insight about how they could be improved.
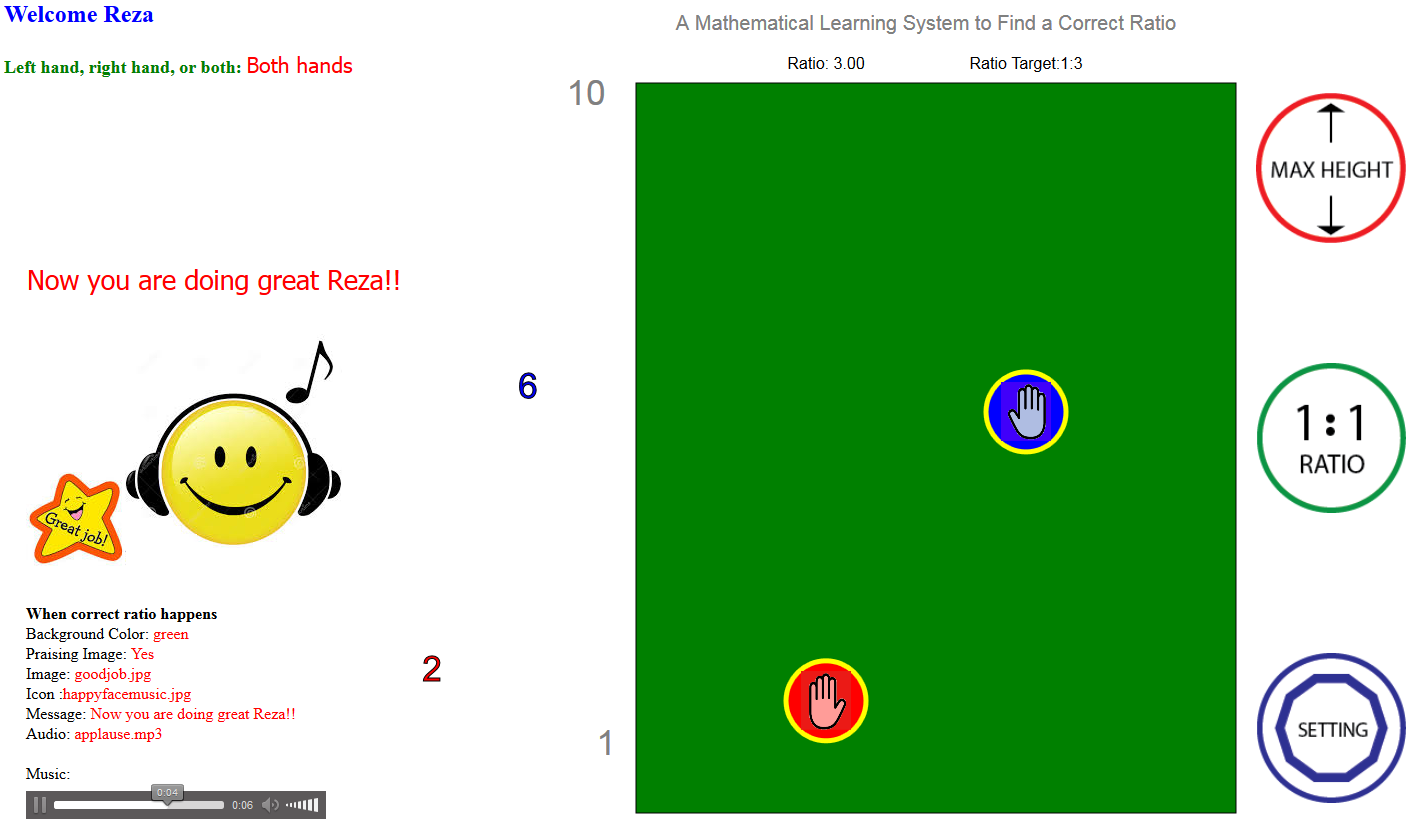
A student sitting at a desk is moving the right hand higher from the desk searching for equivalent proportions 1 to 3 or 2 to 6; a ratio of 1:3 is reached, maintaining the goal proportion and resulting in a ffective feedback of audio, a message, icon, image and screen color change.
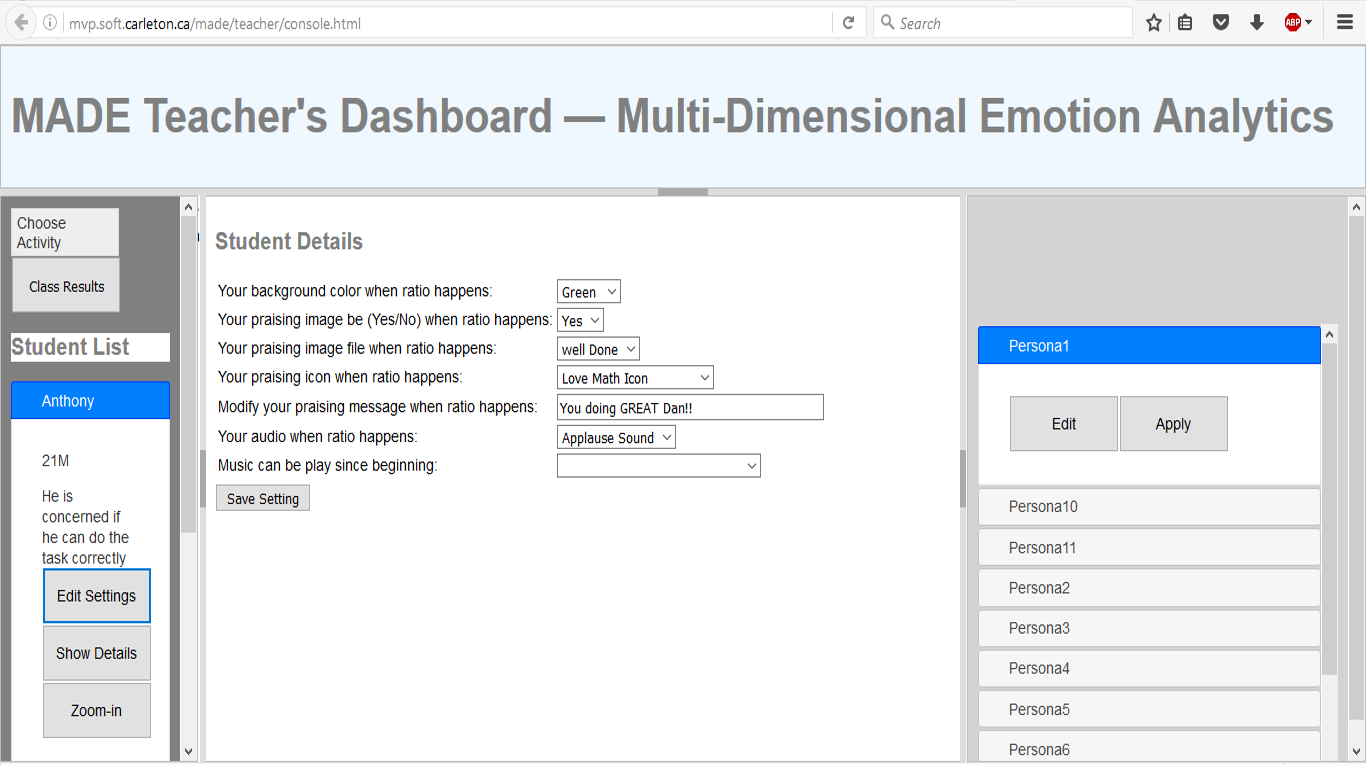
The Teacher’s Emotion Visualization Dashboard
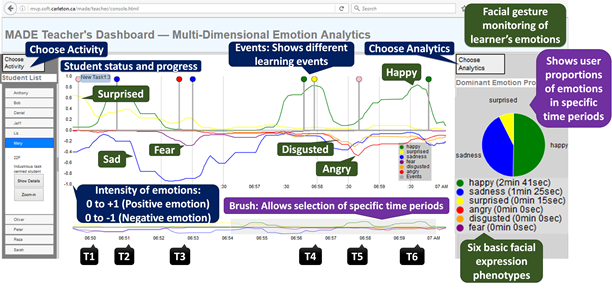
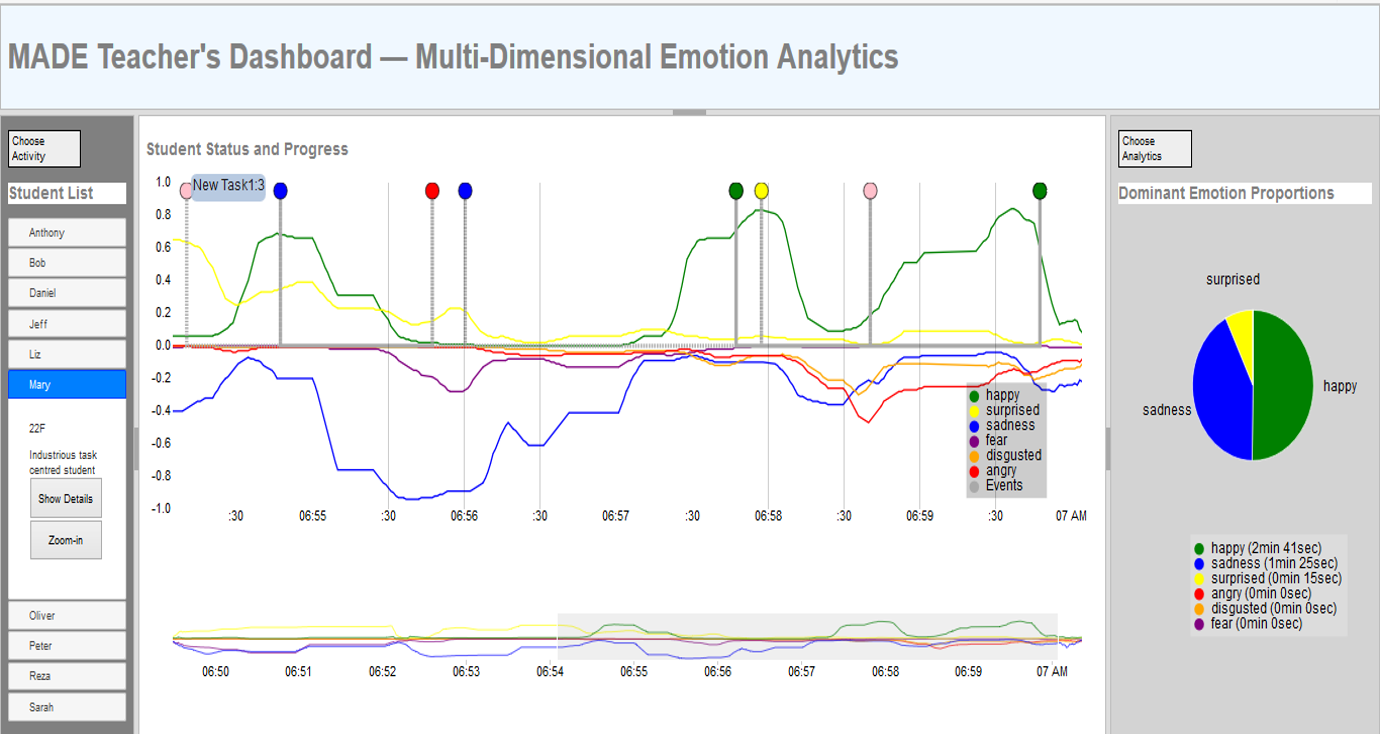
The teacher using the MADE Ratio system might select tasks for the student, such as finding ratios of simple 1:3, or ones that might appear more difficult to understand, e.g. 3:9 or 2:5. The teacher can also select affective strategies for each student. For example, a teacher might know that a student, Mary, likes frequent feedback with audio elements.The teacher can set these to accompany appropriate learning events that occur in use of the MADE Ratio software. The teacher can then monitor or review what happened using the dashboard, as illustrated in the above figure.
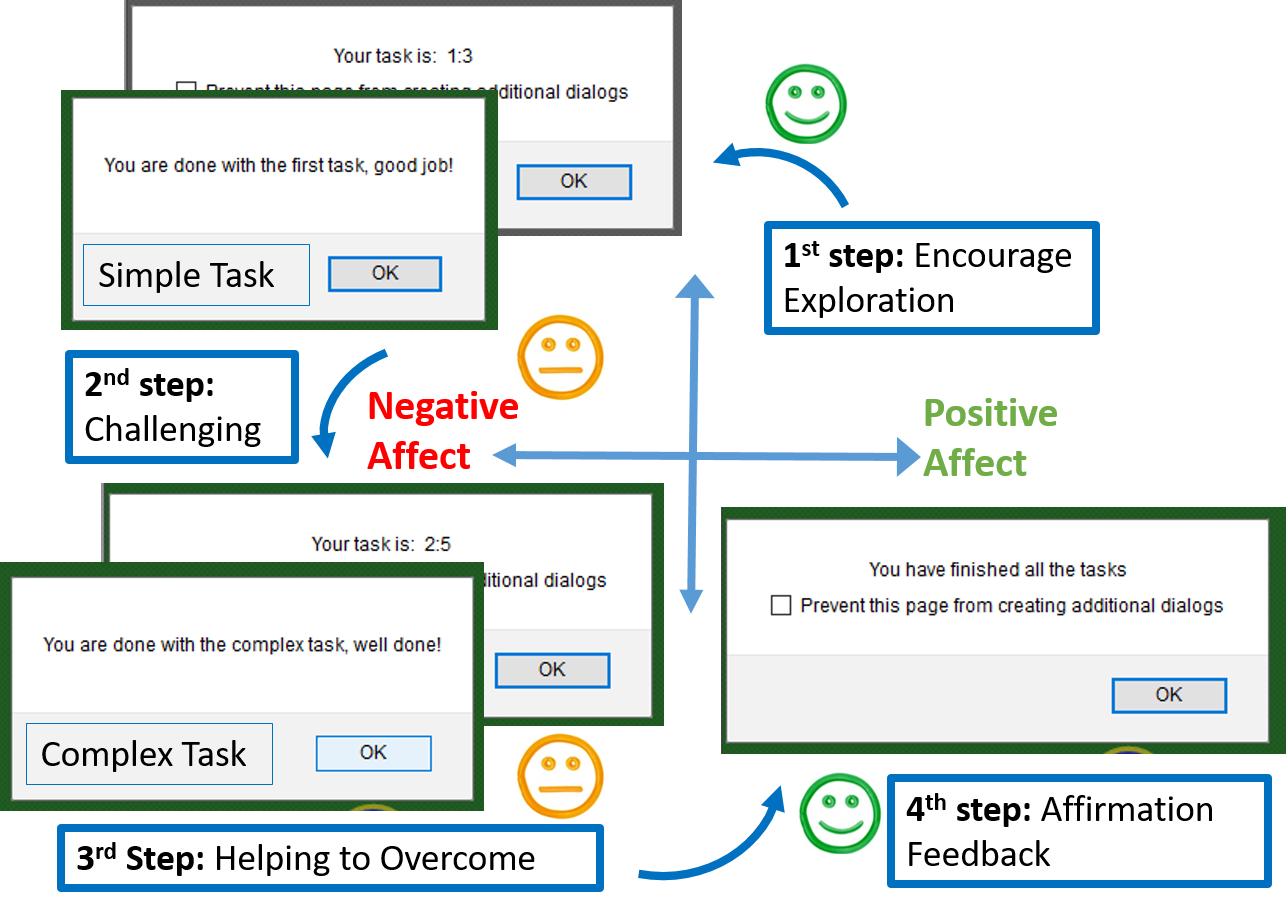
Simplex-complex Task Model for a Specific Learner
We wanted the teacher to come up with the task sequences, and customize the feedback messages with affective strategies. We illustrate this sequence in the above figure. The system provides each user a customized list of tasks from simple to challenging, when they are interacting with the system.
Dashboard Persona-Learner Edit Settings
Figure in below illustrates the dashboard support for personas. It shows the class list on the left side, in the center are the detail settings, and on the right side, the list of personas. The teacher can change the settings and have a specific affective strategy for a specific learner or persona.